Amazon Marketplace Manager · 8 years operating · 12 Amazon storefronts + Etsy / eBay / TikTok Shop
I've held Total ACOS at 11.1% and net margin at 24.9% for twelve straight months across UK, US, Canada and the EU on combined Amazon revenue of £225,716, by treating the account as a data problem rather than a marketing one.
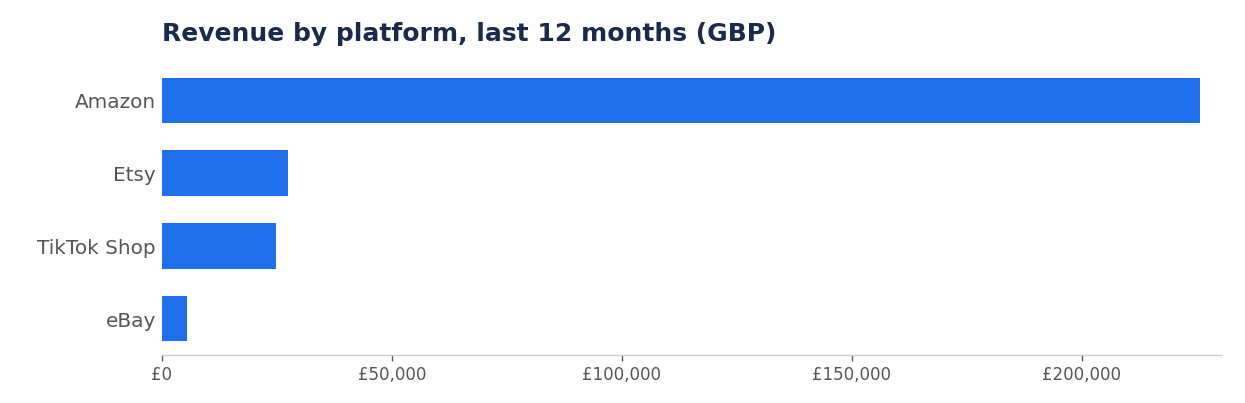
I'm a multi-platform marketplace operator. For the last eight years I've owned and run a private-label brand in the baby and pet keepsake category. Over the last twelve months the brand turned over £283,167 across four platforms: Amazon (£225,716), Etsy (£27,308), eBay (£5,356) and TikTok Shop (£24,787). The primary channel is Amazon, UK, US, Canada and the EU (Germany, France, Italy, Spain, Netherlands, Sweden, Poland, Belgium, Ireland), with VAT, EPR and IOSS compliance handled in-house for every jurisdiction. The off-Amazon channels are operated to the same data discipline.
The brand name, ASINs and product titles have been removed throughout, but every figure, chart and decision below is real.
(12 mo)
(12 mo)
(UK / US / CA / EU)
(12 mo)
Where the brand actually sells, in numbers
Last twelve months, across all four platforms the brand trades on.
(12 months)
(UK / US / CA / EU)
Amazon, the profit engine
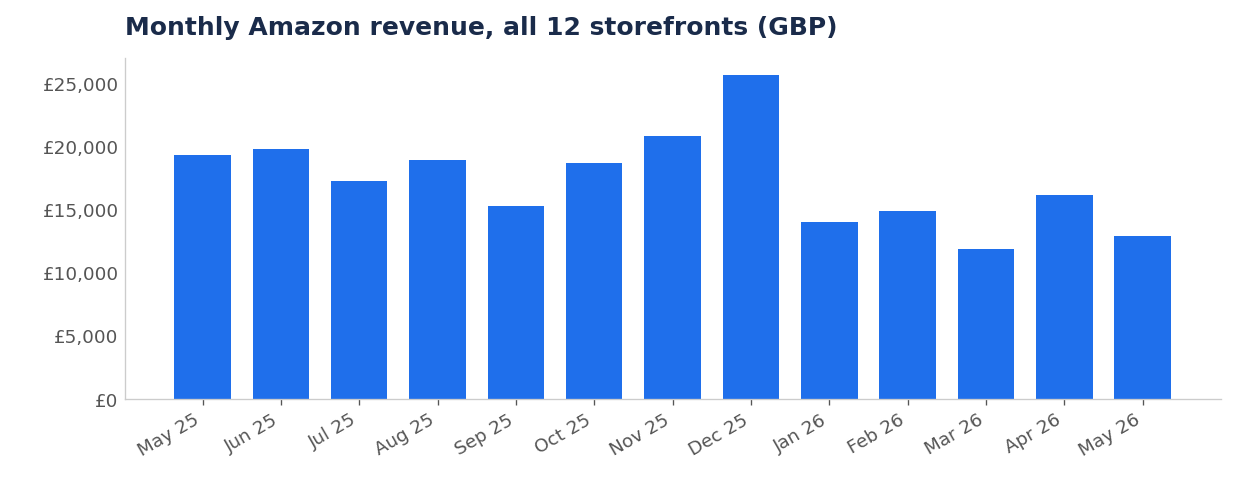
£225,716 revenue and roughly £56,222 net profit over the last twelve months, at 24.9% net margin and 11.1% Total ACOS, across 12 storefronts (UK, US, Canada, plus nine EU storefronts run as a single Pan-EU operation). This is where the operating system below is applied weekly.
Etsy, steady niche channel
£27,308 of revenue over the last twelve months, on roughly 1,812 orders, behind millions of product impressions. Operated as a low-overhead long-tail channel (Etsy SEO, offsite ads, listing-photo iteration) without diverting attention from Amazon.
eBay, profitable secondary channel
£5,356 of sales across roughly 450 orders in the last twelve months, run on the same SKUs as Amazon with eBay-specific ad spend tuned monthly. Refund rate 0.65%. A useful diversification away from a single-platform risk.
TikTok Shop, the discovery surface
£24,787 of video-attributed GMV over the last twelve months, with 2,156,839 video views generated in the most recent 89-day reporting window alone (1 Mar to 28 May 2026). Run as a creator-driven programme with GMV Max creative testing, covered in more detail in the off-Amazon section below.
How I actually run an Amazon account, every week
Four disciplines, applied to every active SKU, in every marketplace.
The data stack underneath every decision
Sellerboard, a third-party Amazon analytics tool that pulls every settlement, fee and refund out of Seller Central in near real time, provides the live SKU-level view of true profit and loss after referral fees, FBA fees (Amazon's per-unit pick, pack and ship charge), advertising spend, cost of goods, VAT and refunds, which I use to do a lot of my analysis and make decisions. Helium 10 handles keyword and competitor research. Amazon's Search Term Report, the weekly export that shows the actual shopper queries that triggered your ads, alongside spend and sales per query, is mined every month for negative-keyword candidates and discovery opportunities. Voice-of-customer signals, NCX rate (Amazon's internal "Negative Customer Experience" score covering returns, complaints and A-to-z claims), return rate, star rating and the wording of recent negative reviews, are tracked as leading indicators, because they move days or weeks before refund rate does.
Inventory policy: roughly three months of cover, no more, no less
The goal is to carry enough stock to avoid Long-Term Storage Fees, surcharges Amazon levies on units that have sat in a fulfilment centre for more than 181 days, but never so little that a hero SKU goes out of stock, because a stockout drops Best Seller Rank (Amazon's hourly per-category sales-rank signal) fast and is expensive to rebuild with paid traffic. In this time period, the median days-of-supply across 30 active SKUs is 195 days, with only 0.42% of units aged over 181 days. Reorder triggers and removal decisions are driven by the FBA age-bucket report, reviewed weekly.
PPC: Total ACOS, not vanity ACOS
ACOS (advertising cost of sales) is the headline number Amazon shows on screen, but it's calculated only against sponsored revenue, the sales it can directly attribute to an ad click. I run everything against Total ACOS instead, which divides ad spend by the account's total revenue, organic and PPC sales combined. It's a truer read of what advertising costs the business as a whole, because much of the organic revenue is driven by the same ad exposure that a sponsored-only ACOS quietly ignores. Negative-keyword sweeps (the monthly exercise of telling Amazon to stop bidding on irrelevant queries the Search Term Report has surfaced) happen every month without exception, and the four ad types, Sponsored Products (keyword/ASIN-targeted ads on the search results page), Sponsored Brands (headline banner ads), Sponsored Brands Video and Sponsored Display (retargeting on and off Amazon), are managed against their own efficiency targets rather than rolled into one number.
Listings: optimisation as a continuous loop, not a project
A/B image experiments run on three-month cycles, because anything shorter is noise. Search terms are embedded into the images themselves, the A+ content (Amazon's enhanced module-based product description that replaces the plain-text description for brand-registered sellers) and the bullet points, and refreshed when the Search Term Report shows a meaningful shift in what shoppers are typing. Customer Experience Health, Amazon's own four-band traffic-light rating of how a listing is performing on returns, complaints and defect rate, is checked weekly: any SKU that falls out of the "Excellent" band gets a forty-eight hour root-cause review covering packaging, copy, and the most recent negative reviews.
Four decisions, in detail
Each one shows the situation I was looking at, the data I used, the call I made, and what happened next. The charts are generated directly from the underlying exports.
Splitting defensive and discovery campaigns, and sweeping negatives every month
The situation. When you let Amazon Ads aggregate everything into a single "ACOS" number, you can't tell whether you're defending a hero ASIN at a healthy 5% or burning money on long-tail discovery terms at 80%. Both end up in the same average. On a small-to-mid Amazon account that one piece of laziness is often the difference between a 22% net margin year and a 12% one.
The data. The monthly Search Term Report and the campaign-level views in Seller Central, broken out by ad type, Sponsored Products, Sponsored Brands, Sponsored Brands Video and Sponsored Display each have very different cost structures and different jobs to do.
The decision. Defensive campaigns are kept tight, targeted at the hero ASIN and own-brand search terms, and held to a very low ACOS. Discovery campaigns are allowed to run hotter while a new keyword proves its conversion rate, with anything underperforming the contribution-margin threshold negated at the monthly sweep.
The result. Over the last twelve months the account has spent £25,024 on advertising against £225,716 of sales, for a Total ACOS of 11.1%. More importantly, the account has been profit-positive every single month, even in the seasonally soft months.
A note on attribution. The headline 11.1% Total ACOS divides total ad spend by total revenue across the whole account, which is the honest denominator but quietly understates how much of that revenue ads actually produced. The on-screen sponsored figure inside Amazon Ads uses same-day attribution, a conservative window that only credits a sale to PPC if the click and the order happen inside one calendar day. On that definition sponsored looks like roughly 20% of revenue, with the remaining ~80% booked as organic. In reality a meaningful share of that "organic" revenue is halo: customers who first discovered the listing via a sponsored placement and came back days later to buy. Re-run the same data on a 7-day or 14-day window and the organic/sponsored split moves materially closer to 50/50. I default to same-day in this case study because it under-claims rather than over-claims the contribution of ad spend; an interview conversation is the right place to walk through the multi-touch view.
Holding roughly three months of cover, no stockouts, almost no long-term storage fees
The situation. Inventory policy on Amazon is a knife-edge. Carry too little and a hero SKU goes out of stock; the Best Seller Rank drops within days and takes weeks of paid traffic to rebuild. Carry too much and Amazon's Long-Term Storage Fees start chewing through margin on units that haven't even sold yet, and cash is tied up in stock instead of going into ads or new product development.
The data. Sellerboard's demand forecast combined with each SKU's lead time and a safety-stock buffer gives a target reorder point. The FBA inventory age-bucket report is reviewed weekly to catch anything drifting into the 181+ day band before it triggers a fee.
The decision. Target a band of roughly sixty to one-hundred-and-twenty days of supply on every active SKU. Reorder when a SKU enters the lower half of the band; submit a removal or run a clearance promo on anything entering the upper half with a slowing sell-through rate.
The result. 30 active SKUs, median 195 days of supply, only 0.42% of units aged into the older buckets. Long-Term Storage Fees over the full year came in at £113 against more than 23,743 units shipped, which is essentially a rounding error on a P&L of this size.
Treating NCX rate, return rate and review wording as leading indicators
The situation. Star ratings are a lagging indicator. By the time a listing's average rating has moved, the damage is already done and recovery takes months. NCX rate, return rate and the specific wording of negative reviews tend to shift first, and if you're reading them every week you can usually catch a quality drift before it reaches the rating.
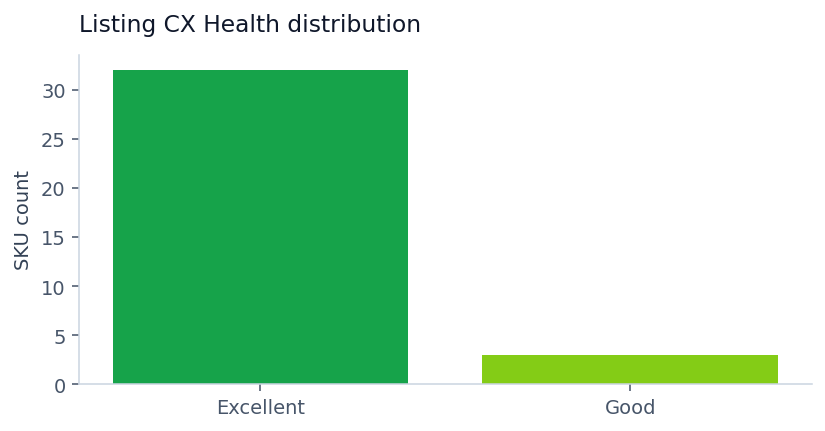
The data. The Listing Summary Report covers 35 SKUs in this snapshot, with NCX rate, return rate and the CX Health classification for each. The overall refund rate across the account this year held at 3.5%.
The decision. Read negative reviews every week, in full, not as aggregated sentiment. Look for patterns of three or more, that's where the real packaging, copy or expectation-setting fixes live. Any SKU dropping out of the "Excellent" CX Health band triggers a forty-eight hour review covering the listing, the packaging and the most recent ten negative reviews.
The result. The CX Health distribution across audited SKUs is shown to the right, and the account's total refund cost over the year came in at £6,152 on £225,716 of revenue.
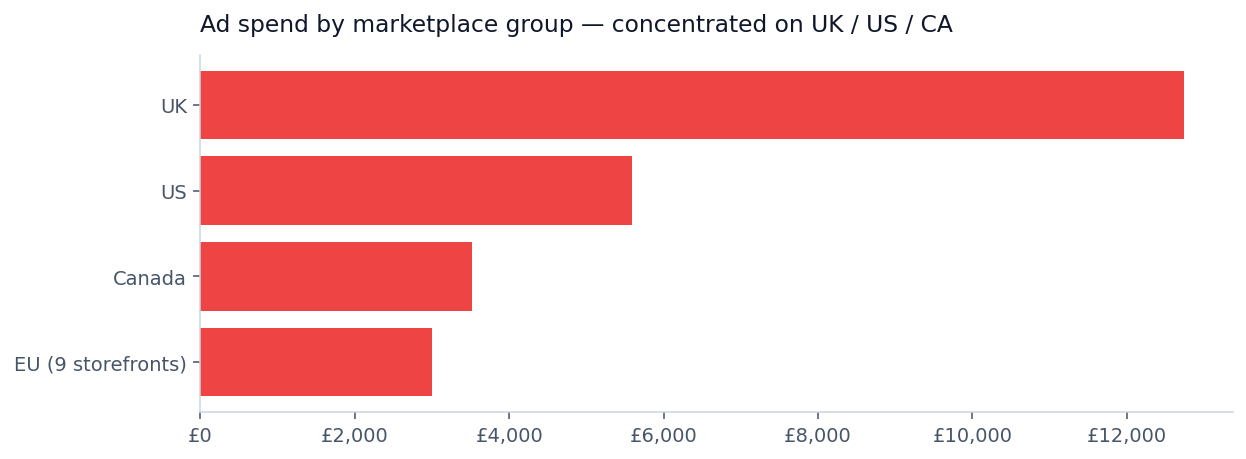
Running 12 Amazon storefronts as four marketplace groups, with ad spend concentrated where it earns
The situation. Selling on Amazon UK alone caps the addressable market roughly at a third of what's available in English-speaking territories and perhaps a tenth of what's available across the EU. Expanding into the EU, US and Canada multiplies the demand pool but also multiplies the operational overhead: VAT registration in each jurisdiction, EPR compliance, language localisation, separate PPC accounts, and the basic question of which markets are even worth the advertising spend.
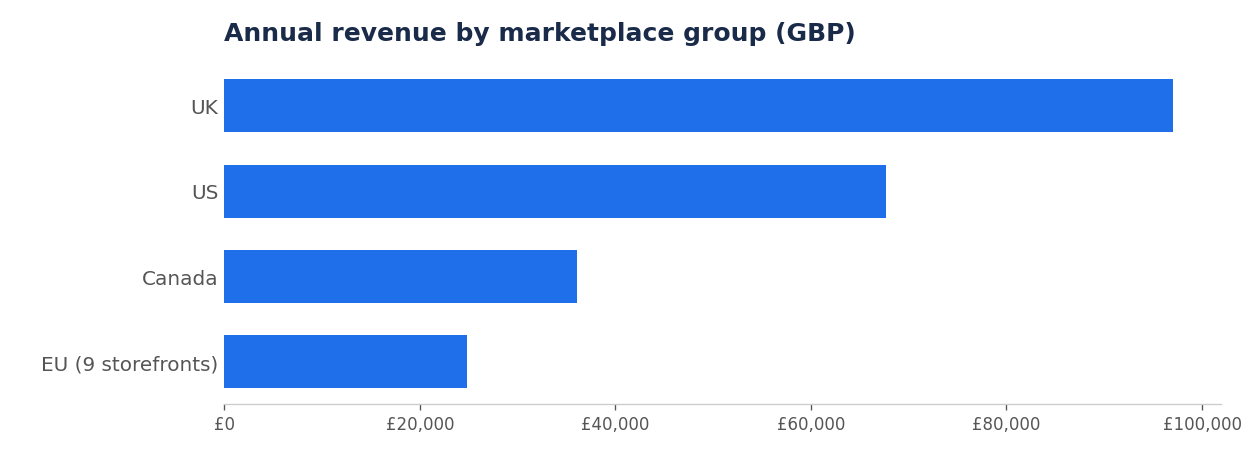
The data. Revenue and contribution are tracked per storefront in the Sellerboard dashboard, then grouped here into four operational categories, UK, US, Canada and EU. The nine EU storefronts (Germany, France, Italy, Spain, Netherlands, Sweden, Belgium, Poland, Ireland) are reported as a single group because operationally they share inventory through Pan-EU FBA (the Amazon programme that holds inventory in one EU fulfilment centre and lets it ship cross-border to all the others at no extra fulfilment fee), a single translated listing set and a single VAT / EPR / IOSS compliance workflow.
The decision. Concentrate ad spend on the three markets that actually justify it on contribution, the United Kingdom, the United States and Canada, which together absorb around 87% of total Amazon advertising. The EU group gets a small holding budget on its larger storefronts (Germany, Italy, Spain, France) to keep the Buy Box defended and feed Pan-EU spillover; the smaller EU storefronts (Ireland, Netherlands, Sweden, Belgium, Poland) are kept open with translated listings but run on organic and cross-border spillover only. VAT and EPR compliance is handled in-house in every jurisdiction rather than outsourced.
The result. Twelve-month revenue is split across the four marketplace groups as shown. The UK is dominant at roughly 43% of Amazon revenue, the United States and Canada together contribute another 46%, and the EU group collectively contributes a meaningful and profitable secondary stream on a fraction of the ad spend per pound of revenue.
Where this goes next. The same playbook extends into the Spanish- and Portuguese-speaking marketplaces, Mexico, Spain and Brazil. I speak both languages (C1) and have lived and worked in Brazil and across Spain and Latin America, so listing localisation, customer messaging and marketplace-specific compliance are handled in-market rather than translated. This would be helpful for a brand or agency expanding into LatAm or Iberia.
What customers are saying, independent of anything I claim
Two of the hero SKUs in the catalogue have accumulated meaningful review depth on Amazon. The star ratings and review counts below are pulled live from the public ASIN pages; the SKUs themselves are anonymised in this case study.
Hero pet keepsake SKU
4.3★ across 1,522 ratings Amazon's Choice
Reviewed by over fifteen-hundred verified buyers, with the Amazon's Choice badge currently held on the primary category keyword. The badge is not bought, paid for or negotiated, Amazon grants it algorithmically to listings that combine a high rating, strong conversion and reliable in-stock history.
Hero baby keepsake SKU
4.4★ across 1,756 ratings
Reviewed by over seventeen-hundred verified buyers. Sustaining a 4.4★ average at this review depth, in a gifting category where the product carries genuine emotional weight, is the lagging confirmation that the listing copy, packaging and the product itself are doing the job they were designed to do.
Other things I do on every account, that aren't fully charted here
Operating practices I run as part of the same job. Left as short narrative below rather than dressed up as full case studies, because the supporting export wasn't included in this snapshot. Happy to walk through any of them on a call.
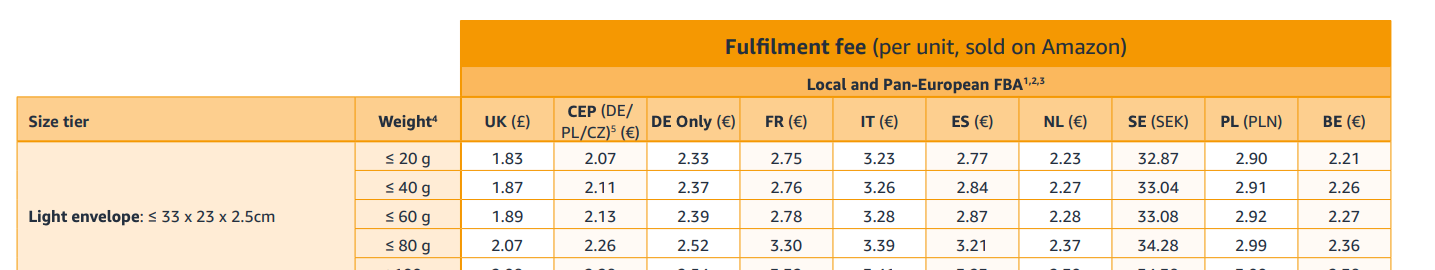
Packaging engineered to fall under FBA fee tiers
One of the hero SKUs was shipping at a packed weight that placed it in the ≤80g Light-envelope bracket of Amazon's UK FBA fee table. By shrinking the product itself and its individual unit box, I brought the packed weight down into the ≤60g bracket on Amazon's next cubiscan, dropping the per-unit UK fulfilment fee from £2.07 to £1.89, and triggering proportional reductions across the EU equivalents. The smaller unit box also let me fit more units into each shipping carton, which cut my per-unit China-to-FBA inbound freight on every replenishment. On the unit volumes this product ships at, that single change is worth a multi-thousand-pound annual margin improvement and the saving recurs every month the product stays on the shelf. I do this fee-tier check on every new SKU before the first inbound shipment.
Price-elasticity modelling before every price test
Before running any price change I build a break-even sheet in Excel that calculates true contribution margin per unit, price minus referral fee, FBA fee, allocated PPC, COGS and VAT, and then works out the minimum volume lift needed to make a proposed price cut profitable on a net basis. Most "small" price reductions fail this test once you do the maths, which is why I run very few of them. The ones that pass run for fourteen days minimum so the data is real, not noise.
Partnering with TikTok creators to drive Amazon sales
Amazon-only is a single-platform risk, and TikTok Shop is primarily a creator-driven channel: creators make videos that drive sales both on TikTok Shop itself and, through the halo effect, on Amazon. I put the catalogue in front of TikTok Shop creators, identified the ones whose audience genuinely matched the product, and used GMV Max, TikTok's bidding tool, simply to boost the videos that were working. Over the trailing eighty-nine days the catalogue accumulated 2,156,839 video views, 2,314,781 product impressions and 454 SKU orders for £6,044 of video-attributed GMV on TikTok Shop alone. Earlier creator partnerships produced bigger individual hits, one video over four million views and several others over two million, and the interesting part isn't the view count itself; it's that Amazon BSR on the same ASIN moved noticeably during and immediately after each viral window, with branded search volume and direct sessions both lifting. Off-Amazon channels can be operated with the same data discipline Amazon demands, and when they are, the halo back onto the Amazon listing is measurable rather than anecdotal.
In-house VAT, EPR and multi-jurisdiction compliance
Every marketplace expansion carries a compliance tail: VAT registration and filing in each country stock physically lands in, EPR (Extended Producer Responsibility, the per-country packaging-waste fees now mandatory in France, Germany, Spain, Austria and the Netherlands), IOSS (Import One-Stop Shop, the EU mechanism for collecting VAT on sub-€150 consignments at point of sale rather than at the border), and the country-specific producer-responsibility obligations that have come in across the EU over the last three years. I've set all of this up myself for each of the 12 Amazon storefronts I sell in, which means I know exactly what an expansion to a new market actually costs in operator time and recurring overhead, before recommending one to anyone else.
What the SKU-level funnel actually looks like
The table below shows the top eight SKUs in the account by revenue over the last twelve months, pulled from the Amazon Business Report (UK storefront). SKU codes and product names have been anonymised; variant identifiers (size and colour) are preserved so the conversion patterns remain readable. This is the kind of funnel view I work from (sessions in, buy box held, conversion rate, revenue out), and it's the starting point for almost every decision about where to push spend or pull it back.
| SKU | Product | Sessions | Buy Box | Units | CVR | Revenue |
|---|---|---|---|---|---|---|
| SKU-C841 | Product A, Large / Black | 14,774 | 100% | 3,151 | 21.3% | £31,320 |
| SKU-CCB1 | Product B, Large / Black | 15,324 | 100% | 1,858 | 12.1% | £18,483 |
| SKU-959F | Product B, Large / Pink | 4,703 | 100% | 597 | 12.7% | £5,947 |
| SKU-3E0F | Product B, Standard / Black | 7,271 | 99% | 683 | 9.4% | £5,440 |
| SKU-E641 | Product B, Large / Blue | 3,480 | 99% | 463 | 13.3% | £4,609 |
| SKU-B0FC | Product A, Standard / Black | 3,136 | 100% | 513 | 16.4% | £4,595 |
| SKU-A2D2 | Product B, Standard / Pink | 3,196 | 100% | 527 | 16.5% | £4,197 |
| SKU-F075 | Product A, Large / Pink | 1,471 | 100% | 279 | 19.0% | £2,762 |
How I'd open with a new account, the first ninety days
The same operating system, applied to your account, broken into three thirty-day phases.
Days 1-30 · Diagnose
Sellerboard is connected and back-filled so we have a true profit-and-loss view per SKU. Every active SKU gets audited for contribution margin, FBA fee tier, days of supply, CX Health and recent review themes. The last twelve months of the Search Term Report are mined and the first negative-keyword sweep goes in. At the end of the month you receive a prioritised list of profit leaks ranked by their pound impact on the account, not by what's easiest to fix.
Days 31-60 · Fix the leaks
The top five leaks from the audit are implemented: PPC negation and bid adjustments, packaging or fee-tier checks on the worst-margin SKUs, an A+ and main-image refresh on the two worst-converting hero ASINs, and a reorder cadence aligned to the three-month inventory policy. Image A/B tests are scheduled to run for the standard three-month cycle so the data is meaningful.
Days 61-90 · Compound
Marketplaces are expanded or rationalised based on contribution per market, with the same active-versus-passive logic applied to your account. The keyword discovery and negation loops are now running on a monthly cadence without needing reminders.
Working together
Three ways I take on accounts. Scope assumes a single Amazon account; multi-brand or multi-marketplace engagements are quoted separately.
Fractional Marketplace Manager
Fractional retainer. Ongoing retainer, capped at two or three accounts in parallel so each one gets real attention.
- Weekly PPC, listing and inventory operations
- Monthly P&L and inventory review with written notes
- Quarterly strategic review and roadmap update
- Slack or email channel for in-week questions
Account audit (project)
Fixed-scope project. Fixed-scope diagnostic with a prioritised action plan you can run yourself or hand to your existing team.
- Full P&L and margin teardown per SKU
- PPC, listing, inventory and compliance audit
- Written report plus a sixty-minute walkthrough call
- Two weeks of email follow-up after delivery
Full-time or long-term contract
Open to the right role. Senior Marketplace Manager or Head of Amazon, in-house with a brand or agency-side managing a client roster.
- UK-based, remote-first, occasional travel
- Available for a paid trial project first
- References available on request
- Comfortable owning P&L responsibility
Who this case study is written for
If you're hiring for one of these three situations, everything on this page is the proof.
Agencies hiring a Marketplace Manager
You manage a roster of brand-side Amazon clients and you need an operator who can pick up a new account, find the profit leaks in the first month, and run a clean weekly cadence without supervision. The systems on this page (true-P&L per SKU, monthly PPC sweeps, three-month inventory cover, weekly review reads) are exactly the operating rhythm an agency client expects from a senior account lead, applied here to my own brand instead of theirs.
Brands hiring fractional Amazon help
You're a founder or operations lead doing somewhere between £250k and £5m a year on Amazon, you don't need a full-time hire, and you want someone who has felt the consequences of every decision they're recommending, because they've made the same decisions on their own balance sheet. The discipline on this page scales directly from a smaller account to a larger one. The categories are different; the system is the same.
Brands or agencies hiring full-time
You want a Senior Marketplace Manager or Head of Amazon who can own the channel end-to-end: P&L responsibility, multi-market launches, PPC discipline, listing quality, and the operational overhead of Pan-EU FBA and international VAT. I've been doing all of that for myself for eight years and I'm open to a full-time or long-term contract role, in-house or agency-side, remote-first from the UK.
A note on the size of this account, before we go further
My own brand turns over £283,167 a year across Amazon, Etsy, eBay and TikTok Shop combined, with Amazon itself split across UK, US, Canada and nine EU storefronts. It ships 23,743 Amazon units a year across 12 storefronts at 24.9% net margin, runs through Sellerboard at the SKU level with the full P&L modelled separately in Excel, and defends that margin every month against the same Amazon fee inflation, PPC bid pressure and inventory-cost dynamics a £5m account faces. The disciplines on this page, and especially the way I think about them, are the transferable part: the same operating system scales cleanly onto a larger account, where the numbers get bigger but the work stays the same.
Want this operating system on your account?
Fractional Marketplace Manager for brands. Contract Marketplace Manager for agencies (white-label, UK timezone). Full-time roles considered.
Book a free 15-min call